CAGR Calculator
Compound annual growth rate measures smoothed yearly growth between a start value and an end value. Use the calculator below, then follow the Excel CAGR formula steps to paste the calculation into any .xlsx or .xls workbook — including POWER and RRI alternatives.
What is CAGR?
Compound Annual Growth Rate (CAGR) is the smoothed year-over-year growth rate that would take an investment from its start value to its end value if it grew at the same rate every year. It is the most common way to compare investments, business metrics, or any two numbers measured over different time spans.
CAGR only sees the two endpoints, not the path between them: a portfolio that doubled and then halved can post the same CAGR as one that climbed steadily. That makes it ideal for apples-to-apples comparisons — and a poor choice for communicating risk or volatility.
CAGR formula breakdown
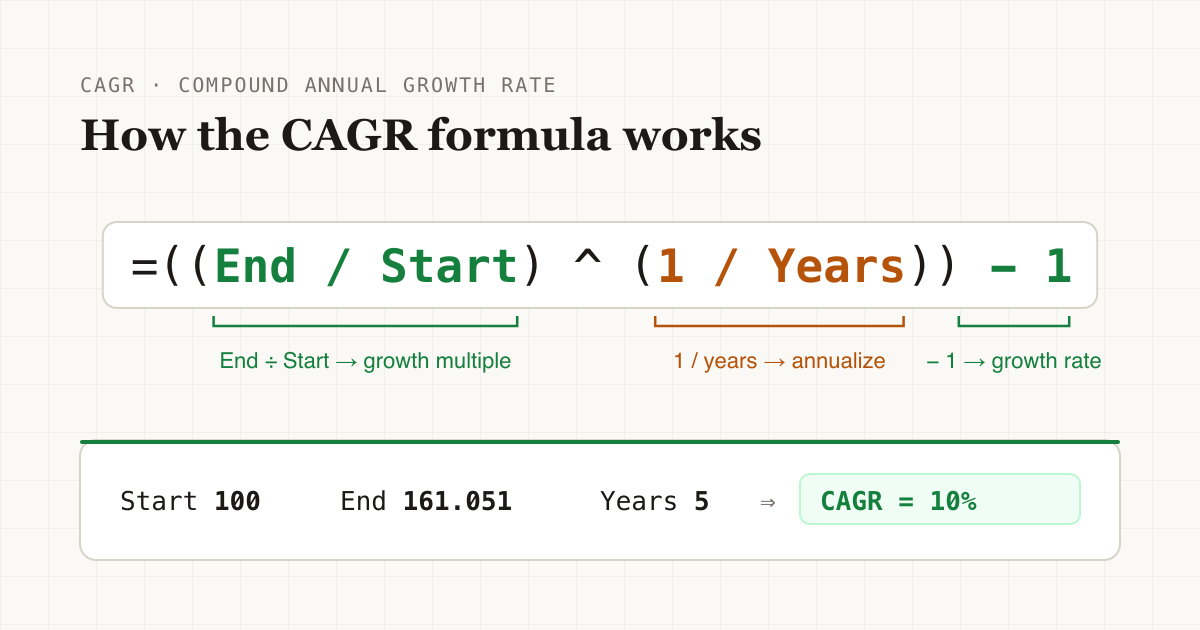
CAGR (compound annual growth rate) uses start, end, and years to measure smoothed annual growth. The result is a decimal (for example 0.1); format the cell as a percentage in Excel to display 10%.
How to calculate CAGR in Excel (4 steps)
- Put the three inputs in cells — Example: B1 = start value, B2 = end value, B3 = number of years. Cell references keep the Excel CAGR formula dynamic when inputs change.
- Enter the CAGR Excel formula — In the result cell type =((B2/B1)^(1/B3))-1. Divide end by start, raise to 1/years, then subtract 1.
- Format as a percentage — Select the result → Home → Percent Style (or Ctrl+Shift+%). 0.1 becomes 10%.
- Sanity-check with a known example — 100 → 161.051 over 5 years should return 10% (0.1). If not, check parentheses and whether years is the period length (not a year label).
Excel CAGR example (paste to verify)
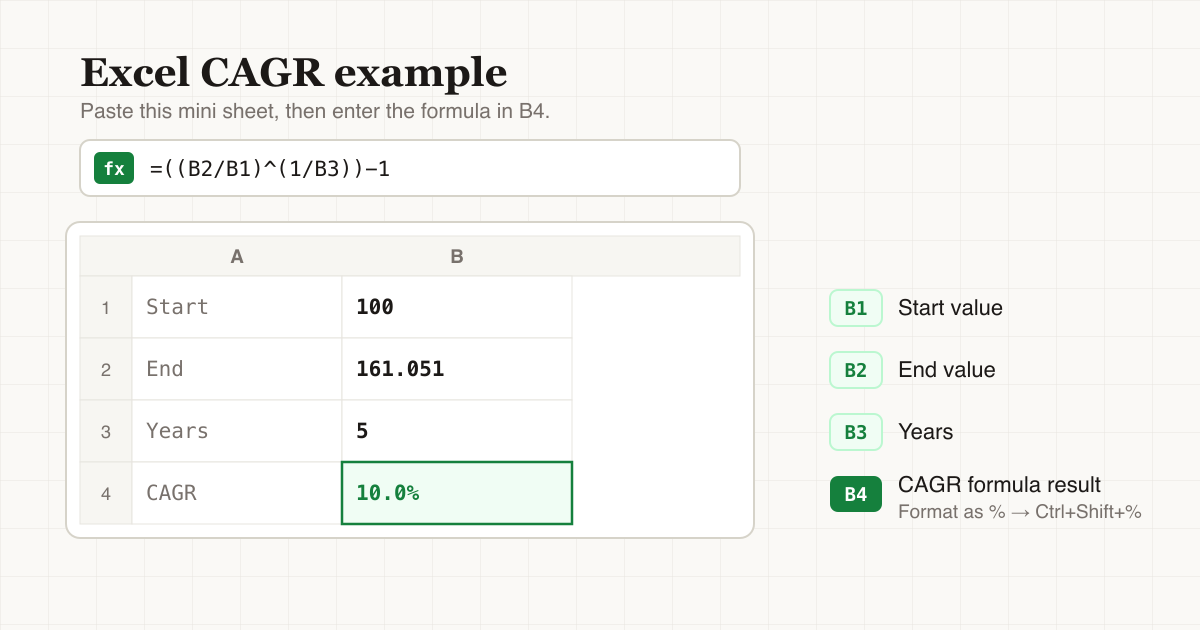
Recreate this mini sheet, enter the formula in B4, and you should get 10%.
| Item | Cell | Value |
|---|---|---|
| Start | B1 | 100 |
| End | B2 | 161.051 |
| Years | B3 | 5 |
| CAGR | B4 | =((B2/B1)^(1/B3))-1 → 10% |
Check: ((161.051 / 100) ^ (1/5)) - 1 = 0.1. This is the standard Excel CAGR calculator formula searchers look for.
Build your Excel CAGR formula
Map the cells to your sheet layout, then copy and paste into the result cell.
=((B2/B1)^(1/B3))-1Two other Excel CAGR formulas
POWER function
Same math as the ^ operator — often clearer in interviews and docs. Works in Google Sheets too.
RRI function (modern Excel)
RRI(nper, pv, fv) returns the interest rate needed to grow pv to fv — numerically equal to CAGR. Available in Excel 2013+. Google Sheets has no RRI; use ^ or POWER instead.
CAGR formula with dates instead of years
If you only have start and end dates rather than a clean year count, compute the number of years from the date difference. Excel stores dates as serial numbers, so subtracting them returns days.
With the start value in B1, end value in B2, start date in B3, and end date in B4. Subtracting the dates gives days; dividing by 365 converts to years. For multi-year spans, 365.25 is slightly more accurate — the difference is negligible for most uses.
Common CAGR mistakes in Excel
Wrong year count
Years is the length of the period (2020→2025 is 5 years), not “number of year labels” on a timeline.
Forgetting to subtract 1
(end/start)^(1/years) is a growth multiple; subtract 1 to get the growth rate.
Zero or negative start
Division by zero or fractional powers of negatives yield #DIV/0! / #NUM!. CAGR assumes positive start and end values.
Leaving the cell in General format
The formula returns 0.1; Percent Style makes it read as 10% so it doesn’t look “wrong.”
Negative CAGR vs. negative end values
If the end value is below the start (but still positive), CAGR is negative — that’s correct, the value shrank. But if the end value itself is negative, raising it to a fractional power produces complex numbers and Excel returns #NUM!. Switch to absolute return or percent change instead.
When to use CAGR (and when not to)
Use CAGR when:
- Comparing long-run growth of two or more options over different durations — CAGR puts them on the same scale.
- Reporting historical performance as a single summary number.
- Projecting forward while assuming a smooth, continued growth trend.
Don’t use CAGR when:
- You need to communicate risk or volatility — CAGR smooths everything out and can hide a wild ride.
- The series starts at zero or ends at a negative value — the math produces #DIV/0! or #NUM!.
- Cash flows happen mid-period — use IRR or XIRR instead, which handle multiple flows at their actual dates.
For irregular cash flows, Excel’s =IRR() works on equal intervals and =XIRR() handles actual dates — both are better fits than forcing CAGR onto the problem.
FAQ
What is the CAGR Excel formula?
Use =((end / start) ^ (1 / years)) - 1. With Start in B1, End in B2, and Years in B3: =((B2/B1)^(1/B3))-1. Format the result as a percentage.
How do I calculate CAGR in Excel with POWER?
POWER is equivalent to the ^ operator: =POWER(B2/B1,1/B3)-1. Same result as =((B2/B1)^(1/B3))-1, and it works in Google Sheets too.
Can I use the RRI function for CAGR?
Yes in Excel 2013+: =RRI(years, start, end), e.g. =RRI(B3,B1,B2). It returns the same rate as the classic CAGR formula. Google Sheets has no RRI — use ^ or POWER instead.
How do I do a CAGR calculation in Excel?
The standard CAGR calculation in Excel is =((end/start)^(1/years))-1 — e.g. =((B2/B1)^(1/B3))-1 with Start in B1, End in B2, and Years in B3. It works in both .xlsx and legacy .xls workbooks.
Does CAGR assume constant growth?
Yes. CAGR is a smoothed annual rate; it does not show the path of volatility between start and end.